App owners spend thousands of dollars each month on app store optimization services, hoping their product climbs the app charts. The fear of wasting that budget is valid. They deserve more than visually polished reports that fail to explain whether their ASO investment is improving rankings, installs, and conversions. Without clear numbers tied to real outcomes, it is almost impossible to know whether the ASO agency’s work is improving app rankings, installs, and conversions.
A good app store optimization (ASO) agency will show keyword rankings by position and weekly install counts broken down by source. It will also track conversion rates across the app store conversion funnel, from listing impressions and product page visits to install taps and completed downloads. Those three categories alone tell most of the story.
The rest of this article names the exact measurements that matter, explains why each one connects to revenue, and helps any app owner ask smarter questions at their next monthly review.
Here we will talk about the seven KPIs every ASO agency should be tracking for their clients in order to help you protect their budgets.
Here are the seven measurements that separate results-driven and honest partners from those who hide behind busy dashboards.
Keyword position rankings show the exact spot where an app shows up in search results for a specific phrase. Position one, position five and position fifteen all mean very different things for visibility and installs. A dependable partner trails at least 20 to 30 targeted keywords weekly and not monthly. This is because rankings can shift after an algorithm update. They separate high intent phrases (the ones people type right before downloading) from the broad awareness terms that seldom convert. A decline from position three to position nine on a phrase with 2,000 monthly searches can cost hundreds of installs in a week. The report should name the keyword, show the previous rank, show the current rank and explain the cause behind the shift. That level of detail is the basic standard worth expecting.
Impressions measure how many times the app appeared in front of a user inside the store. A strong app store optimization agency breaks this into at least four buckets. These include search impressions, browse impressions, category page impressions and featured placement impressions.
Each bucket functions in a different way. Search impressions can climb up when keyword rankings get better, and browse impressions rise when install speed is strong.
A total impression count of 50,000 means very little without knowing which bucket drove it. If search impressions drop 30 percent week over week, the team needs to look up ranking losses immediately. If browser impressions spike, it may signal that a competitor lost a featured slot. Breaking apart the number turns a single data point into an authentic diagnostic tool that guides the next week of work.
Tap-through rate measures how many people who saw the app in search results really tapped to view the full listing. The industry average for most categories lies between two percent and five percent. Anything below two percent pinpoints to a weak icon, a dull app name or a subtitle that says nothing valuable. A good partner tests icon designs against each other using Apple’s product page optimization tool or Google’s store listing experiments. They track tap-through rate separately for branded searches vs. category searches, because the audiences work differently. An uplift from 2.8 percent to 4.1 percent on a keyword that is driving 5,000 weekly impressions adds roughly 65 extra product page visits per week at no added cost. That math is the kind of success a good partner brings to every review call.
Once a user reaches the product page, the screenshots, preview video, description and ratings take over. This conversion rate tracks how many of those visitors click on the install button. A weak product page with a 20 percent conversion rate on 1,000 visits produces 200 installs. Enhancing that to 30 percent produces 300 installs from the same traffic. That is 100 extra installs per week without spending anything extra on acquisition.
The partner should conduct split tests on screenshot order, caption text and video thumbnails. They should report the exact variant tested, the sample size, the result and whether the test reached statistical significance before declaring a winner. Gut-feel design decisions cost real money while data-backed ones compound over time.
Total install numbers feel great until the paid and organic counts get separated. A steady ASO program grows organic installs month over month without requiring paid support to mask their weak performance. The agency should report organic installs from search, organic installs from browse and organic installs from referral traffic as three distinct lines. Paid installs from Apple Search Ads or Google UAC should sit in their own column entirely. When organic installs grow from 800 to 1,100 over 60 days, the team earns that win easily. When an agency inflates total install counts by running paid campaigns, the organic story gets buried. Keeping the two columns separate is a basic standard, and any partner worth hiring will offer it without being asked.
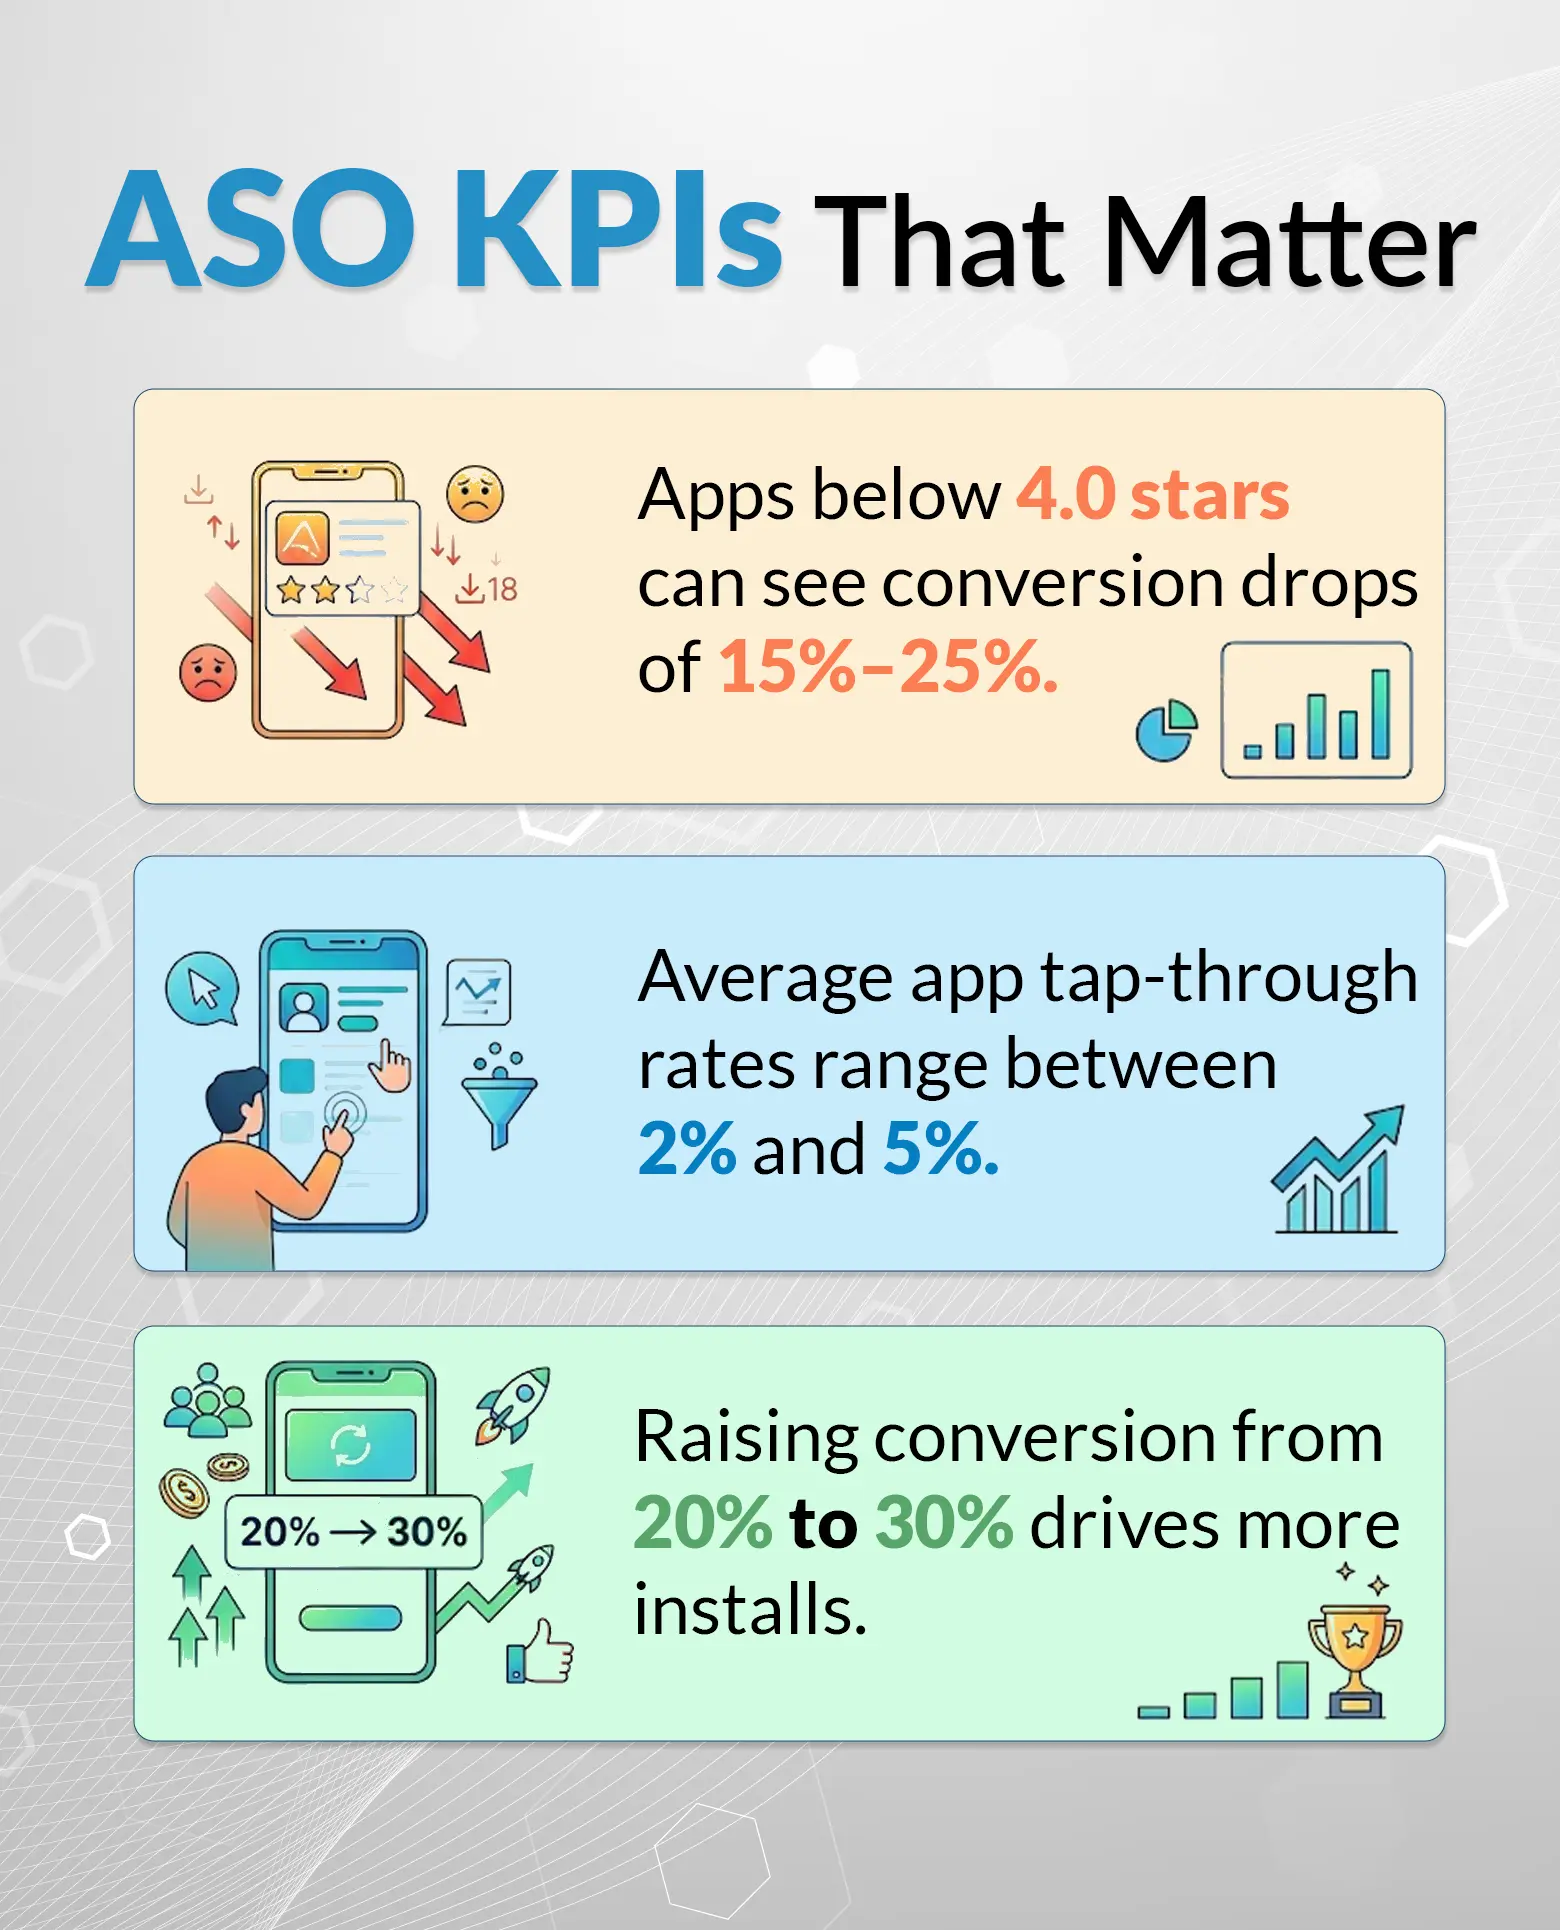
A dip down of 0.3 stars over six weeks is not something insignificant. Research across major app categories consistently shows that apps rated below 4.0 stars see conversion rates fall by 15 percent to 25 percent when compared to apps rated above 4.4 stars.
The agency should track average star rating weekly, count how many new reviews arrive each week and flag any sudden change in sentiment. Negative review spikes often indicate a new app update that introduced a bug. Identifying that within 48 hours and alerting the product team saves from a deeper ratings slide.
Overseeing app store optimization metrics at the review level, not just the summary level, is the difference between managing reputation and losing it quietly over several months without realizing what happened.
An install that never opens again is not a success. Retention rates measure what percentage of new users return to the app one day, seven days and thirty days after installing. A partner who only celebrates download counts is missing the most important part of the story. Retention data tied back to specific keyword groups reveals something powerful—that some keywords attract loyal users while others attract one-tap curiosity seekers.
If users coming from the phrase “budget planner app” retain at 38 percent on day seven but users from “free finance app” retain at 11 percent, the team should shift metadata weight toward the higher quality phrase immediately. This is how smart ASO works. It connects directly to lifetime customer value, the number that determines whether the product survives long term.
These numbers sit behind the main seven and help explain the full picture each month.
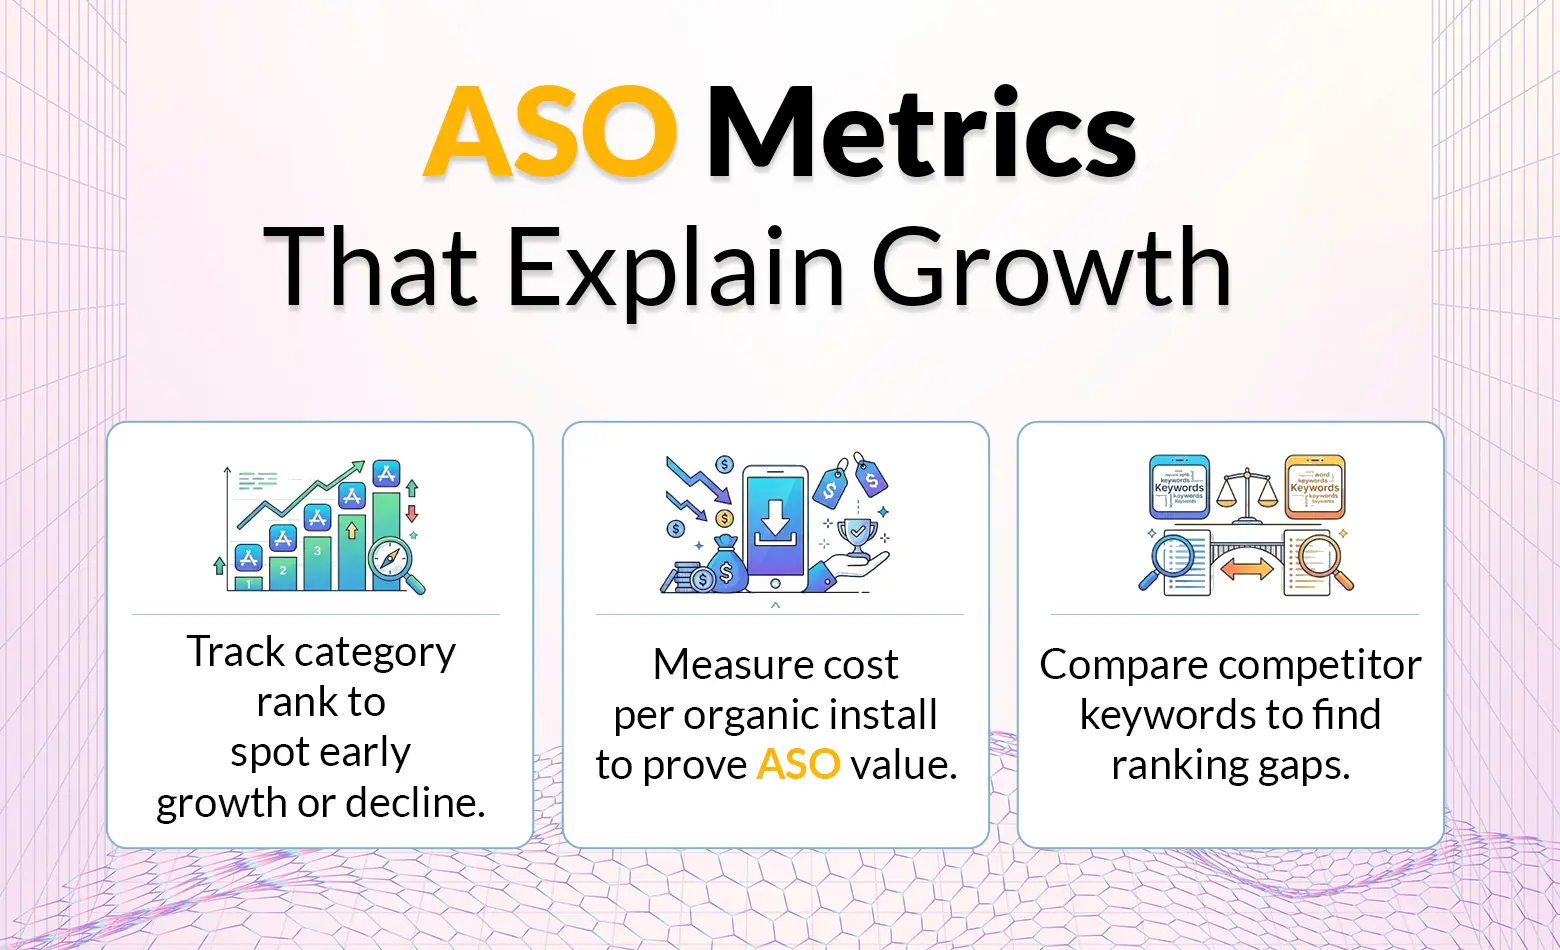
Category rank shows where the app sits against every other app in its store category. A fitness app ranked 42nd in Health and Fitness has a very different growth path than one ranked 180th. The partner should track this weekly, name the top five competitors in the category and show movement direction.
A climb of 20 positions over 30 days signals healthy install velocity and strong retention signals reaching the algorithm. A slide in category rank often predicts a drop in browser impressions before it shows up in the install numbers, which makes it a useful early warning sign.
As part of honest KPIs for mobile app marketing reporting, cost per organic install tracks how much the overall ASO investment costs per download earned without paid support. Divide the monthly agency fee by the number of organic installs that month. If the fee is CAD 3,000 and organic installs are 600, the cost per organic install is CAD 5.00. Watching this number fall month over month proves the program is compounding. A good partner will include this calculation in every report, because it shows the honest return on the work being done each month.
Competitor keyword overlap gauges how many of the same search terms the app shares with its top three rivals. A low overlap score means the app is seen on different phrases than its competitors. This can be a smart choice for positioning or a dangerous blind spot, depending on the category.
The partner should map at least the top 15 keywords of each named competitor and show which ones the client app ranks for and which ones it does not. This study directly informs where to invest metadata updates and creative testing in the next weeks.
Apple and Google both feature apps editorially and those placements can drive thousands of installs in a weekend. The agency should track every pitch directed to editorial teams, every response received and every feature that lands. Even a tiny feature in a regional store like Canada or Australia can add 400 to 800 installs in 72 hours at no cost. A partner who never pitches for features is leaving proper growth unclaimed. Monthly reporting should include a log of pitches sent, the angle used for each one and the response status so clients can see the effort.
A proper monthly report is not a mere dashboard export. It is a transparent conversation about what happened and what comes next.
Every report should open with a three- to five-sentence summary written in easy-to-understand language. No chart titles, no percentage tables, just a proper paragraph explaining what moved, why it moved and what the team plans to do about it.
If a client cannot read that opening paragraph and immediately understand the month, the report has failed its most basic job. Easy language is a sign of respect for the client’s time and a gesture that the team understands what the numbers mean.
Numbers without context create false confidence or unnecessary panic. Every monthly report must show the client app’s keyword positions, impression totals and install counts beside the same numbers for two or three named competitors. Did the top competitor climb up to fifteen positions on a shared keyword while the client held flat? That conversation will be worth it.
To measure ASO performance accurately, an agency must track how the app’s keyword rankings, installs and conversion rates change over time. App store results are constantly affected by competitors, algorithm updates, reviews and user behaviour. Everyone is moving, and the client deserves to know where they stand relative to their competition.
Every split test running or recently completed should appear in the report with four pieces of information. These include what was tested, what the result was, what sample size was reached and what action the team is taking next. A screenshot of the winning variant should also be attached.
This proves that the team is functioning properly between reporting cycles and not passively overseeing numbers. Clients who observe a live test log every month can rely on their partner more than those who receive a clean dashboard with no proof of the work behind it.
The final section of every report should be a short action plan. Each item needs a specific task, a named person responsible and a completion date. “Continue optimizing metadata” is not an action item. “Refresh subtitle copy on the English UK listing by the 12th.”
This level of specificity shows that the partner respects the client’s investment and understands that proper accountability is what separates a good working relationship from a bad one. Clients should be able to check back on the previous month’s action plan at the beginning of every new review call.
Hiring the right app store optimization agency is one of the most important decisions that supports your app’s growth. The seven KPIs above are genuine. Keyword ranks by position, impression breakdowns by source, conversion rates at each funnel step, organic installs separated from paid, star rating trends and Day Thirty retention rates together tell the complete story. Any partner unwilling to report all seven is either hiding a weakness or does not know how to measure them. Both are reasons to look somewhere else for a competent app store optimization agency.
A complete report once per month works well for most budgets. A concise weekly update covering keyword rank movement and install counts keeps clients informed between full reviews. More consistent updates than that rarely add value and often create unnecessary noise in the data.
Tap-through rate from search results to the product page matters most in the early weeks. It tells whether the icon, name and subtitle are earning attention in a crowded list. Fixing this number first multiplies the value of every other improvement made afterward.
Yes. Many apps build strong organic install volume through keyword work, creative testing and review management alone. Paid campaigns can accelerate early momentum, but they are not required. A well-optimized listing earns installs from search and browse without ongoing ad spend.
Most apps see early keyword movement within four to six weeks of a focused metadata update. Trend data takes closer to ten to twelve weeks to form. Anyone promising top rankings in under two weeks is either misleading the client or describing paid placements and not organic growth.
Small apps often get the strongest proportional gains from ASO because the bar for visibility in niche categories is lower. A program covering keyword research, screenshot testing and review responses can produce proper install growth without the large budgets bigger competitors spend on paid acquisition.
Reports that show total installs without separating organic from paid are the clearest warning sign. If the partner cannot or will not break that number apart, the client has no way of knowing whether the ASO work itself is producing any results at all.